Following the distribution of the Newsline – the dam special edition, I have fielded a number of communications questioning the level of “propaganda” that council has stooped to. Initially, I was somewhat surprised of the response as my copy had not been delivered. Interestingly, councillors had been receiving a pre release copy of Newsline for proof reading. This copy was not circulated prior to publication, so I did not have an opportunity to address the errors before it went public. Given that my opportunity to address issues privately was not given I will address my issues in the open forum.
Without getting bogged down in the fine print, I will just address the glaringly obvious propaganda as presented pictorially. The first obvious use of “Lies, Damned Lies and Statistics” (as penned by an author of disputed origin) is found in the picture on the front page.

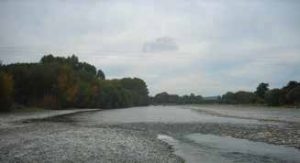
One wonders why a discussion about the Waimea Plains, as affected by the Waimea Community Dam, shows a picture of the Wai-iti Plains – not affected by the Waimea Community Dam?
Yes, it is possible to see the Waimea plains in the distance, but a good half of the land pictured shows land that comes under the 88 Valley (or commonly referred to as the Kainui) water scheme and is not affected by the Waimea Community Dam discussion.
The use of the picture really just highlights how little land mass we are really talking about when we hear the stories of great woe that befall the world food supply (as present to council by John Palmer) or the national food supply (as reported in Newsline). Yes, there may be some impact locally to vegetable prices until another source is found in a no dam scenario, but a dire impact globally? Interestingly, the boutique crop of hops as mention in Newsline are mostly grown outside the Waimea Community Dam catchment – which makes one wonder if John Palmer is writing Newsline now.
Moving on we come to the pictures following the Mayor’s soliloquy.
Sorry, these are not the dam pictures they are pictures of Bailey – winner of the 90 day weight-loss challenge at lifetime-weightloss.com. And while I congratulate Bailey on her efforts, I find the photos used here typical of photos used in this genre of advertising.
And I am sure that many of you will have noticed that in advertising the benefits of the Waimea Community Dam that we have used the same template as the traditional weight loss miracle cure before and after photos.
With a dam we use the flash on, bright colours, full make-up, hair fresh from the salon, and big smile template. It is a sunny day, we have chosen a cross-section of the river where there is lots of green grass in the picture, and the fish are playing happily (we can assume).
 Without a dam the story is much different. There is no smile, no make-up, no flash photography, and the hair is messy. Or at least the picture has been photo-shopped to appear devoid of 90% of the colour. Ironic really given that the water crisis generally occurs mid summer. We have also chosen a different cross-section of the river that contains no greenery, only grey lifeless gravel, and one can only imagine in this Armageddon-like scene that the fish are not smiling at all.
The reality is that had both pictures been taken from the same perspective on equally sunny days you would barely see a difference between an 1100 litre per second flow an 800 litre per second flow.
Of course that is not the only occurrence of where we have refused to let the facts get in the way of a good story.

“Average” in a mathematical sense usually refers to a mean average or a median average figure. Median being a mid point figure, and mean referring to number generated when the sum of figures is divided by the number of figures used.
In this list of common water usage activities the term Average would appear to mean something entirely different – I am not sure what. Take for instance the average figure given for flushing the toilet, here it is given as 11 litres. While old single flush toilets may have used 11 litres per flush or more, the Caroma national survey reveals 60% of households use a split flush system, most of which operate on a 6/3 litre flush and newer design toilets are even more economical again with their water use. So, for the “average” flush to be 11 litres some people must be using their bath as a header tank to flush the toilet.
The same can also be applied to the 5 litre figure given for hand washing. That is two and a half ice-cream containers of water used for every hand wash. Some people must have a lot higher water pressure than me, or they take an extra ordinarily long time to wash their hands, or again, they are filling the bath to wash their hands if the “average” figure is 5 litres per hand wash.
The next chart that I would highlight is exactly the kind of use of statistics that the author of the “lies, damned lies, and statistics” quote would have been referring to, I am sure. 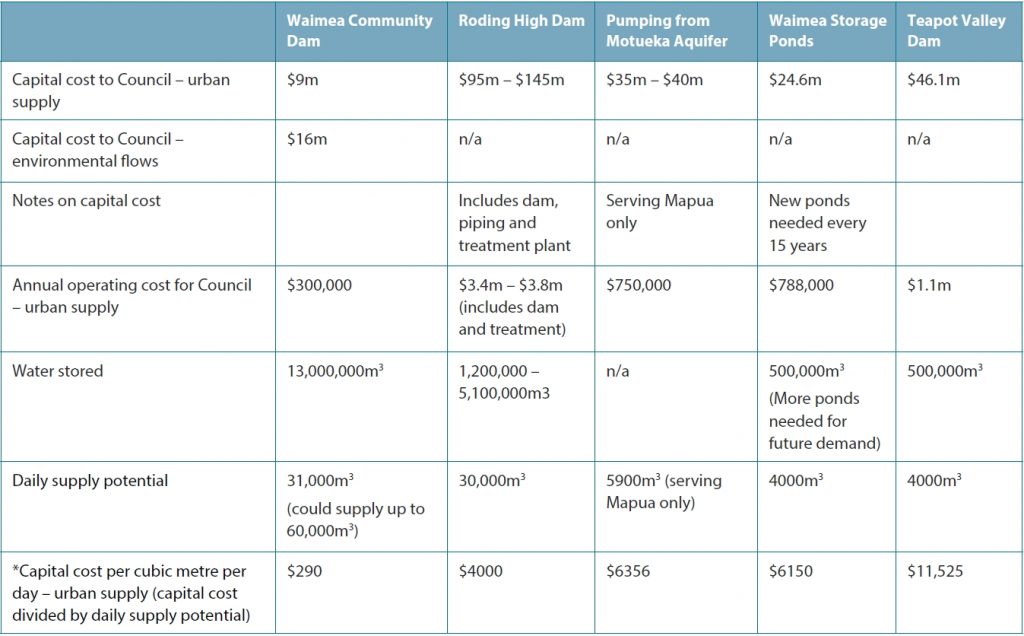
Council staff will apparently tell you that this accurately represents the associated costs of the dam to urban water users.
The first fallacy is that it assumes that urban supply users are not general ratepayers as well because there is no ongoing costs for “environmental flow” included in the graphic – which is odd because they include the environmental flow component of construction costs. Even in this model urban supply users will be paying general rate subsidies of the actual cost of water supply from the Waimea Community Dam. I repeat, these figures are not shown on the table.
The other issue with this model is that “environmental flow” costs have been segregated out in the first place. When this model was first presented to council environmental flow was described a separate entity from water extraction. What has since come to light is that environmental flow is a direct cost of using the river as a conduit to run water from the augmentation source (the community dam) to the end user.
The reason that all the other options looked at are outrageously expensive by comparison to the Waimea Dam is because all the other options have to include piping from augmentation source to end user. We cannot use the river as a conduit to channel the water if we are putting in X litres of water at the top and taking the same X litres of water out at the bottom of the river (or where ever extraction occurs). To use the river in this manner would necessitate supplying a certain level of environmental flow above the water extraction levels which none of the other options have capacity for.
Not only is there a saving in piping by using the river as a conduit, there is also a large saving from treatment because the river is doing the bulk of the “treating” of the water for us when it is used as a conduit.
Therefore, the cost of using the river as a conduit (rather than piping and potentially treating) is that environmental flow has to be accommodated for. This is not a “public benefit” cost that should be attributed to the general rate payer, this is a water extractor cost that is currently being directly subsidised by the general rate payer. Another means by which the general rate payer is being expected to prop up the billion dollar industry generated from irrigation on the Waimea Plains.
Finally, I would question the doughnut chart that depicts financial contributors to the dam.
Little details like the “SPENT” portion is added on the opposite side to the council contribution could raise eyebrows. I am wondering what genie contributed these spent funds. At this rate the dam will be built using “spent funds” and council will announce that we have saved the rate payer $25 million by not using the allocated budget from the Long Term Plan, even if it costs council $50 million in spent funds.
But, I guess that is how we can keep council contribution to the quoted 33% if we don’t include spent funds, which looks like a really good bargain.
There is also the small matter of CIL contributions included as the same colour as Waimea Irrigators $15 million contribution. In my business education I understood that the person who underwrites a loan is the person responsible for the loan (many a parent, and best friend, has come unstuck by not fully appreciating this fact). Given that council is being asked to underwrite the CIL loan it could be considered misleading at best, and down right deceptive at worst, to attribute that loan directly as WIL contributions.
If the Waimea Community Dam is the goose that lays the golden eggs:
as the proponents of the dam would have us believe, then why is it consistently being over-sold?
The most damage to the dam progress has not been fliers delivered by Murray Dawson or other anonymous detractors. The most damage to dam goodwill among the general rate payers is the constant and consistent propaganda put out by the Council and Waimea Irrigators.
Why are we using suspect at best statistics, and outright lies to sell what is reputedly a no-brainer for the Tasman District?
Yes, I said outright lies. If you consider that none of the above are lies, then panic not. I have other examples where I have been directly lied to in relation to questions I have raised, and information that has been presented to me as a councillor with regard to the Waimea Community Dam. Examples that will have to wait for another post as this post is supposed to be a quick analysis of some of the obvious propaganda presented in the Newsline special edition.
We could have looked at some of the anomalies in the small print but given that the recipients of Newsline are obviously deemed to be imbeciles by the authors of Newsline one would assume that the recipients don’t read the articles.
Perhaps the Waimea Community Dam is actually a lemon painted up to look like a Ferrari?
Perhaps we should accept the offer ( or threat, depending on how you read the articles) of the Waimea Irrigators who have publicly stated they will pack up and move on if the dam is not built? That would solve the over allocation of water situation amongst the irrigators and those that remain will then have a greater security of supply.
It is hard to see the best solution amidst all the smoke and mirrors and statistics spewing forth from the irrigator/council marketing department.